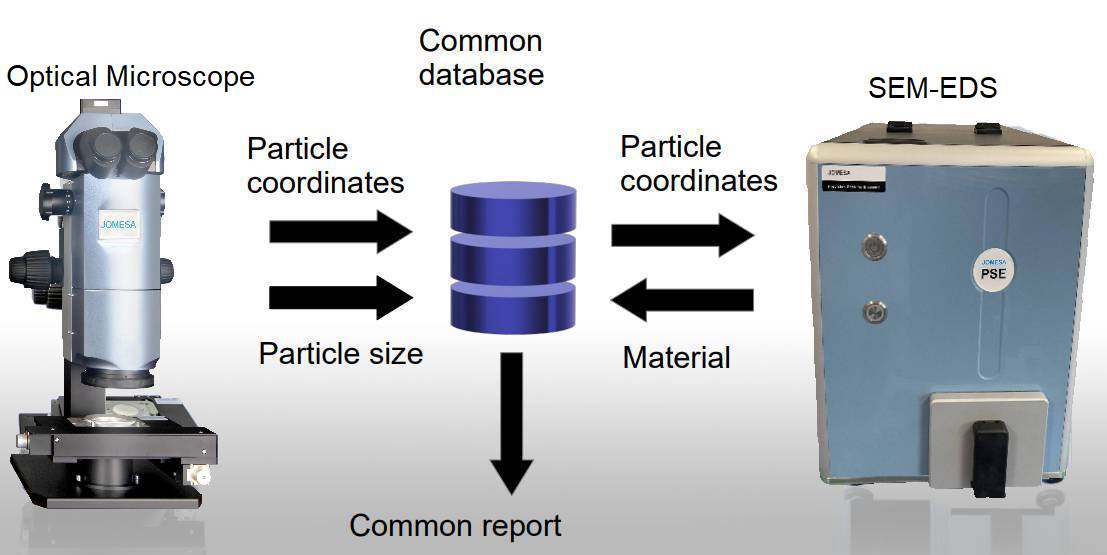
deutsch

Correlative Mikroscopy: Combination of Optical and SEM Data


Optical microscope: JOMESA HFD

  • Fast scan of filter/particle trap

  • Evaluates particle sizes and positions

  • Sorts into metallic, nonmetallic and fibers

  • User can mark particles for fast SEM-EDX analysis

  • Stores results into database

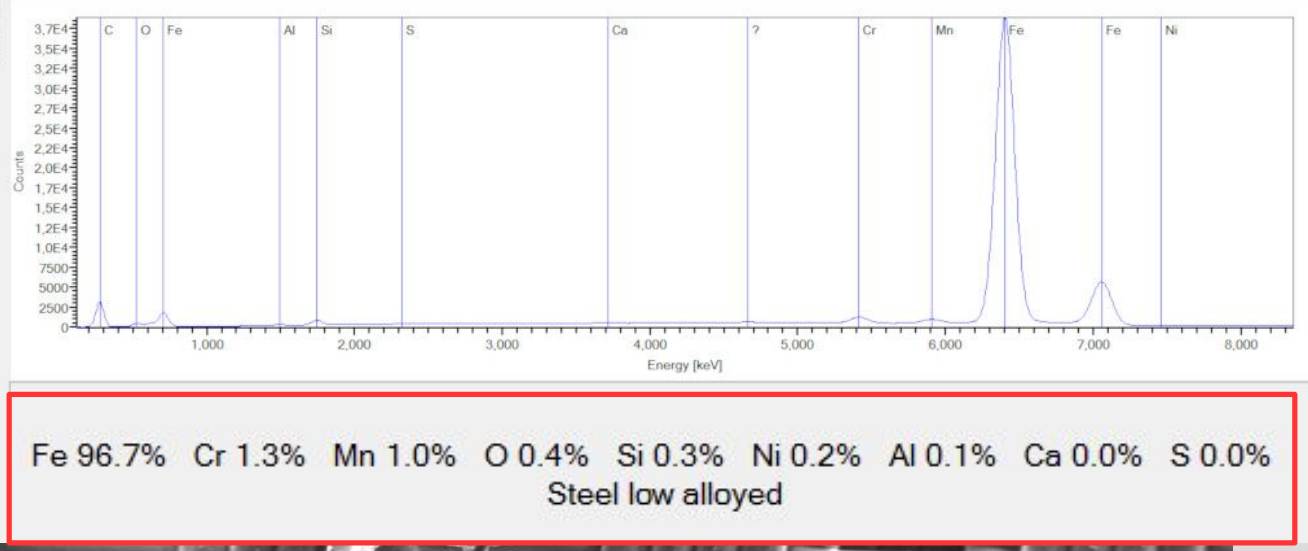
SEM with EDX: JOMESA PSE

  • Reads particle informations from database

  • Fast SEM-EDX analysis of selected particles

  • Optional: Full scan or all optical particle scan

  • Stores results to database


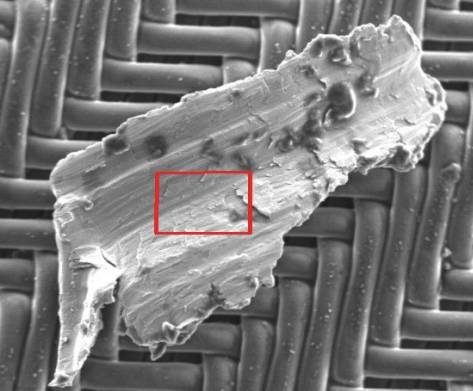
JOMESA PSE screen: shows optical and SEM image


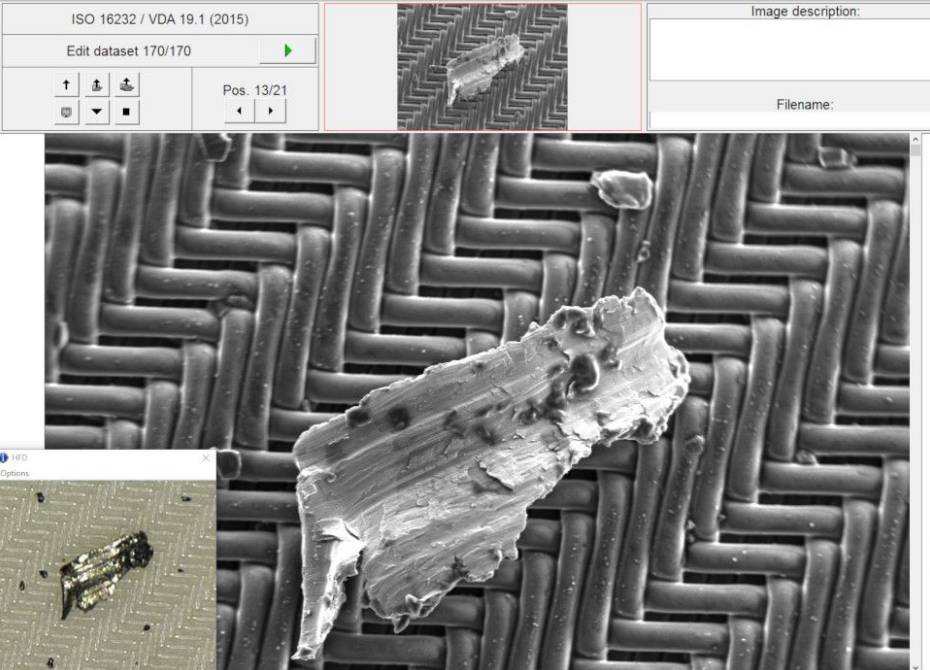
Choosing area for EDX analysis


SEM-EDX versus LIBS:
Optical microscopes with LIBS option can analyze only particles found in optical analysis.
SEM analysis can add information about particles not seen in optical data.

SEM image can look quite different than optical image and reveal much information


Optical image

SEM image


Somtimes critical components (glass, abrasice materials) cannot be detected with optical methods


Optical image (glass fiber)

SEM image (glass fiber)


One cannot compare the particle counts of optical (HFD) and SEM (PSE) methods.
These two detection princples "see" particles different.


Material

Optical detection

SEM detection

Organic (fiber)

good

bad

Graphite

good

bad

Corundum

bad

very good

Glass

not at all

very good

Salts

bad

very good